Climate Variability and Extremes
Has Temperature Variability Increased?
There is widespread concern that climate variability will increase due to radiative forcing by greenhouse gases. While it is true that events such as heat waves will become more likely with future warming due to the asymmetric effect that even small shifts in global mean temperature have on rare events (see figure below), it has also been implied that climate is becoming more variable in the sense of each year drawing from a broadening probability distribution.
There is widespread concern that climate variability will increase due to radiative forcing by greenhouse gases. While it is true that events such as heat waves will become more likely with future warming due to the asymmetric effect that even small shifts in global mean temperature have on rare events (see figure below), it has also been implied that climate is becoming more variable in the sense of each year drawing from a broadening probability distribution.
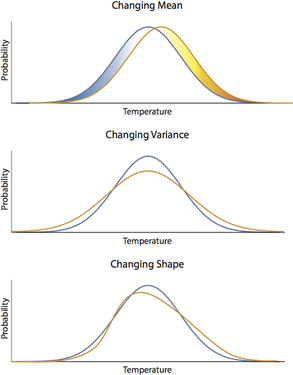
Changes in the frequency of climate extremes aren't just about the average: while an increase in mean temperature would produce more hot events and fewer cold events (top), the variability of climate could change independent of the mean so that there are more cold events as well (middle). The distribution may also change shape, leading to changes in extreme events that are difficult to predict.
Initial analyses suggested that the climate system has become substantially more variable on monthly timescales (e.g., Hansen et al 2012), however our analysis has shown that the data and methods used thus far do not support this conclusion (Rhines and Huybers 2013):
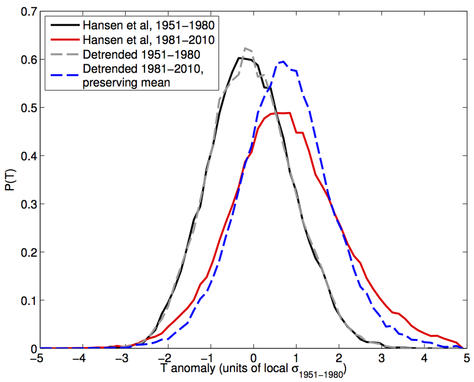
Inferred changes in the global mean distribution of monthly temperature anomalies following Hansen et al (2012). When accounting for several statistical biases introduced by this method of standardization, the variance is found to be unchanged between the 1951–1980 and 1981–2010 periods.
Using the same data and methods, we have found that observed changes in the frequency of rare events are consistent with a simple increase in the mean temperature (Rhines and Huybers 2013). The discrepancy arises because, when standardizing data from across the globe, spatial variability is suppressed through cancellations, while temporal variability is aliased as changes in the distribution. These statistical biases lead to the erroneous conclusion that variability has increased. Our result doesn't mean that variance changes are not present, rather that methods and data used to date are inadequate to identify any such changes, likely because of the focus on aggregating over space to increase effective sample sizes. It is clear that we must move towards spatial inference – after all, people and ecological systems experience climate variability locally, not on the global scale – lest we throw the baby out with the bathwater.
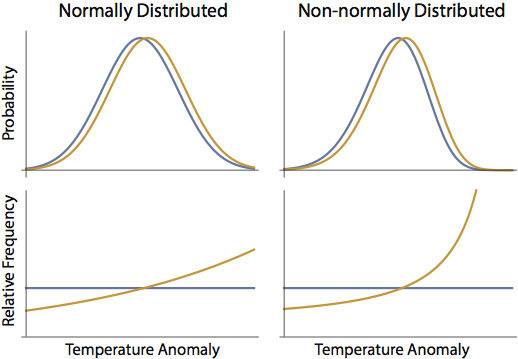
Changes in climate extremes under warming are sensitive to the shape of the temperature distribution. Consider two climates: one with normally-distributed temperature, and the other with a negatively skewed temperature distribution. For the same uniform increase in average temperatures (from the original climates in blue, to the warmer climate in brown), a non-normally-distributed climate will experience very different changes in the frequency of rare events when compared with a normally-distributed climate. The relative frequency of hot events in the warmer climate, normalized to the original climate, is much more sensitive to warming in the negatively-skewed case. Knowing the shape of the base distribution is therefore a major part of predicting the local effects of climate change.
To properly detect changes in variability requires a more careful approach that is designed from the ground up to asses distributional trends while retaining spatial variability. Our approach has been to apply quantile regression to daily observations of surface temperature from weather stations distributed around the globe. Quantile regression is ideal because it robustly estimates distributional changes without parametric assumptions about the temperature distribution (i.e., no assumptions about normality need to be made, the importance of which is illustrated above). Furthermore, it is efficient with time series containing missing values, allowing us to infer distributional changes without an additional process model for infilling. Drawing local inference before taking spatial averages ensures that averaging over spatial variability intrinsic to the fluid earth system does not wipe out the signal. In ongoing work we have confirmed that temperature variability has not been generally increasing.
Seasonal Prediction of Heat Waves
While there is little hope of making skillful deterministic forecasts of weather phenomena beyond several weeks, predictions of the second kind (i.e., probabilistic forecasts, Lorenz 1969), are in many ways more valuable from the perspective of risk assessment. We have developed a technique for dimension reduction that identifies spatial clusters of locations that experience similar heat waves. By focusing on a coherent region in the northeastern quadrant of the U.S., we show significant skill in forecasting the likelihood of heat waves up to 39 days in advance. We make use of relatively long persistence in particular ocean temperature patterns that in turn tip the scales in favor of persistent high-pressure weather systems to the east of the Rockies. The ocean temperature pattern leads to a five-fold increase in the chance of heat waves in this region. Ongoing work to simulate this phenomenon in a state-of-the-art global climate model suggests that nonlinear amplification of quasi-stationary Rossby waves by surface forcing leads to the growth and maintenance of large-scale blocking patterns that intensify surface temperature.
While there is little hope of making skillful deterministic forecasts of weather phenomena beyond several weeks, predictions of the second kind (i.e., probabilistic forecasts, Lorenz 1969), are in many ways more valuable from the perspective of risk assessment. We have developed a technique for dimension reduction that identifies spatial clusters of locations that experience similar heat waves. By focusing on a coherent region in the northeastern quadrant of the U.S., we show significant skill in forecasting the likelihood of heat waves up to 39 days in advance. We make use of relatively long persistence in particular ocean temperature patterns that in turn tip the scales in favor of persistent high-pressure weather systems to the east of the Rockies. The ocean temperature pattern leads to a five-fold increase in the chance of heat waves in this region. Ongoing work to simulate this phenomenon in a state-of-the-art global climate model suggests that nonlinear amplification of quasi-stationary Rossby waves by surface forcing leads to the growth and maintenance of large-scale blocking patterns that intensify surface temperature.